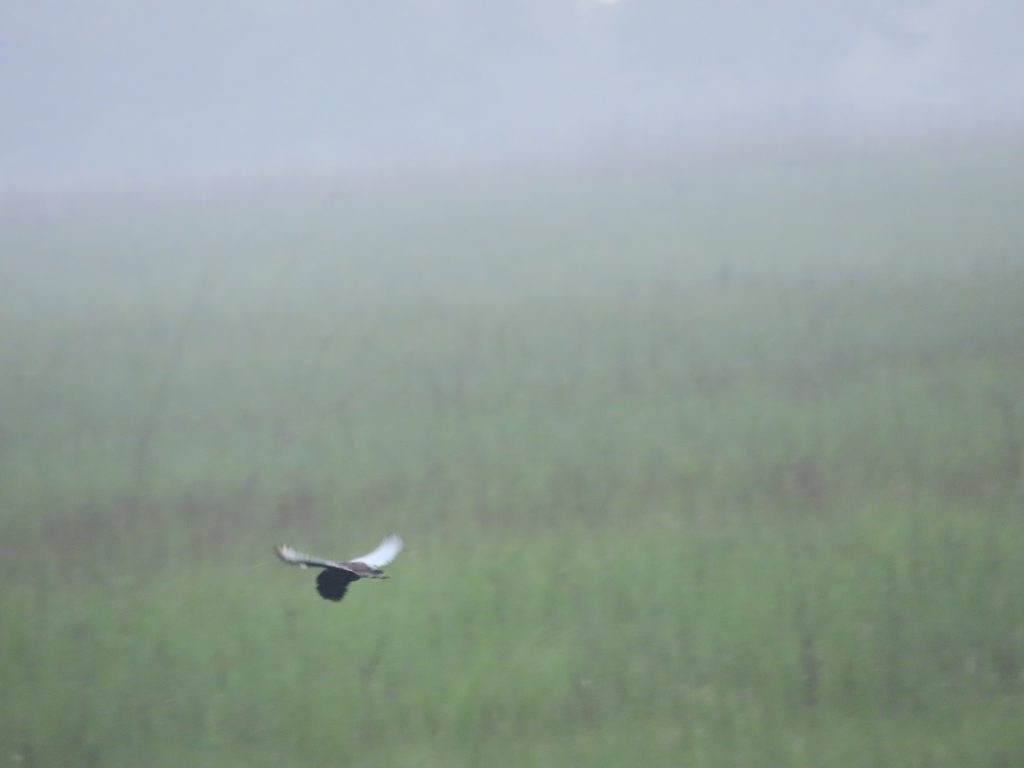
The vast, sweeping phantas (alluvial grassland meadows) of Shuklaphanta National Park in far-western Nepal represent one of South Asia’s most spectacular ecosystems. Yet, underneath the scenic horizon hides a quiet ecological crisis. The Bengal Florican (Houbaropsis bengalensis), an exquisite, grassland-dependent bustard, is teetering on the absolute edge of regional extinction. With fewer than 1,000 mature individuals remaining globally, and Nepal’s national count slipping below 100 birds, our window for evidence-based intervention is closing fast.
In Shuklaphanta alone, historical records reveal a staggering reality: local populations have declined by more than 90% over the last four decades. Driven by a competitive research grant from the Rising Explorers Club, my study set out to clear the data fog surrounding this iconic bird and deliver the precise spatial metrics required to protect it.
Objective of the research
While conservationists widely recognize that invasive plants, altered fire regimes, and illegal livestock grazing destroy grasslands, site-specific, data-driven answers are rare. The primary objective of my independent research project is to rigorously evaluate the structural condition of remaining habitats and pinpoint exactly how natural and anthropogenic threats interact inside Shuklaphanta National Park.
Specifically, the project addresses three goals:
- Locating and mapping active habitat zones using GIS and remote sensing.
- Diagnosing grassland health across high-density, low-density, and highly disturbed transitional zones.
- Modeling how distinct pressures – like overgrazing, fires, and invasive plant species—affect where the birds choose to live.
Fieldwork : What Data We Secured
With the intense field data collection phase successfully completed, my team and I have gathered a robust ecological dataset directly from the ground. Our fieldwork successfully combined boots-on-the-ground ecological sampling with modern geospatial tracking across a systematic grid.
1. Sighting Records & Spatial Layouts
Using a combination of early-morning jeep transects and stationary vantage point observations from towers, we tracked displaying males and foraging birds when they were most active. Every positive sighting was flagged with high-accuracy handheld GPS units. These coordinates have been securely cataloged to be layered directly onto Sentinel and Landsat satellite imagery to map micro-habitat perimeters.
2. Vegetation & Biophysical Sampling
To analyze the structural composition of the grasslands, the park was segmented into distinct disturbance zones. Within $1\text{ km}$ transects, I established $5\times5\text{ m}$ grassland plots and $10\times10\text{ m}$ shrubland plots. In each plot, we successfully documented:
- Dominant grass species composition (e.g., Imperata cylindrica and Saccharum spontaneum).
- Average canopy height, vegetation density, and overall cover percentages.
- Invasive weed infestation rates, particularly tracking the spread of Mikania micrantha and Chromolaena odorata.
3. Quantified Threat Indicators
Human and ecological pressures were explicitly measured and quantified within our sample plots. Livestock grazing intensity was determined using systematic dung counts and visible soil trampling signs, while historical burn patterns and grass-cutting activities were noted across different zones.
Translating Data into Mathematical Insight
Now that we have returned from the field, our focus has fully shifted to the data analysis and report preparation phase. The raw numbers are currently undergoing rigorous quantitative analysis to pull out meaningful trends:
- Hotspot Modeling: GPS data layers are being run through a GIS Kernel Density Analysis to visually pinpoint critical survival clusters inside the park.
- Vegetation Plant Communities: We are computing the Importance Value Index ($IVI = \text{Relative Density} + \text{Relative Frequency} + \text{Relative Cover}$) alongside the Shannon-Wiener Diversity Index ($H’$) to evaluate exactly what structural plant communities support breeding bustards.
- Pearson Correlation ($r$): By running presence/absence data against environmental gradients via Pearson coefficients, we are mathematically isolating which variable—be it invasive weed cover, grass height, or grazing pressure—inflicts the heaviest damage on species distribution.
$$\text{Species Diversity Index } (H^{\prime}) = -\sum_{i=1}^{S}p_{i}\ln(p_{i})$$
What This Research Will Achieve
This project is built to deliver functional, practical tools for conservation managers, not just sit on an academic shelf. Upon completing our analysis and drafting the final technical report, this research will supply:
- A High-Resolution GIS Habitat Atlas: Detailed maps showing verified distribution hotspots, nesting zones, and high-risk threat intersections to guide daily park ranger patrols.
- A Grassland Quality Matrix: A clear baseline report detailing the exact structural conditions of Shuklaphanta’s vegetation to optimize seasonal grass-cutting and controlled burning operations.
- Community-Facing Outreach Materials: Simplified brochures and regional workshop presentations designed to turn our scientific data into collaborative, community-led anti-poaching and grazing management strategies.
Protecting the Bengal Florican means saving the wider, fragile ecosystem it represents. By combining precise data analytics with our completed field research, we aim to give this incredible flagship species a real chance to thrive in the wild once again.
Mapped habitats using GPS and Kernel density, sampled vegetation diversity, and applied Pearson correlations to isolate drivers of a 90% population decline.